March 10th, 2026

Here's a look at everything we shipped over the past couple of weeks - new features, meaningful improvements, and a few fixes that were overdue
🆕 Look up values across your tables
You can now enrich any table by pulling in matching values from another table in your workspace - similar to a VLOOKUP in a spreadsheet, but built natively into Databar.
Pick a target table, choose which column to search in, set your match condition (contains or equals), and map in the value to look up - including dynamic column references using the { syntax. The result lands as a new column in your table. This is especially useful for cross-referencing CRM exports, matching enriched contact data, excluding competitors or sensitive contacts or companies from your list building and enrichment processes, or joining any two datasets on a shared field without leaving Databar.
🤫 Databar MCP Server (easter egg)
We've quietly published a hosted MCP (Model Context Protocol) server for Databar. This means you can now connect Databar directly to AI tools and coding assistants that support MCP - like Cursor, Claude, and others.
We will be officially announcing this shortly - for now, if you read this changelog, you get to use it early. 😉
Read the full API documentation at its new permanent home at docs.databar.ai.
✨ Simpler row adding
The "Add rows" button has been improved to be less complicated. By default, clicking it adds a single row to the bottom of your table. If you need more control, a small chevron menu lets you specify the number of rows and whether they go to the top or bottom.
✨ Rate limits on the API & SDK
We've introduced rate limiting across the Databar API and SDK. Limits are managed per plan, ensuring consistent and fair performance for all users. If you're building on top of the Databar API, you'll now see clear, predictable limits so you can design your integrations accordingly. Check your plan details for specifics.
🆕 Never run out of credits unexpectedly — low credit alerts
You can now set up an email alert that notifies you when your workspace credits drop below a threshold you define. Head to your workspace settings, enable the alert, set your threshold, and you'll get an email the moment your balance dips below it - giving you time to top up before any enrichments or automations are interrupted.
The alert is off by default, so nothing changes unless you turn it on. Once enabled, only the workspace owner receives the notification, and you can adjust or disable it at any time from the same settings page.

Other updates
UI Updates on drop-downs, modals, and menu items
General bug fixes & updates
February 28th, 2026
⚡ Webhooks: Instant Table Setup (New)
Setting up a webhook just got a lot faster. Previously, clicking "Webhooks" sent you to a docs page and required multiple manual steps to get a working table. Now, clicking "Webhooks" instantly creates a new table with the webhook pre-configured and the setup panel already open - your unique webhook URL is ready to copy immediately.
Value: go from zero to a live, receiving webhook in seconds - no extra steps, no docs page.
➕ New Importers & Integrations
We've expanded the Import Data modal with 9 new sources. You can now pull data directly into Databar from:
Calendly: Import all scheduled events from your Calendly account, including event name, start/end time, location, host, invitee name, email, timezone, and answers to any custom booking questions. Great for syncing your meeting pipeline into a table automatically.
Attio: Import your contacts, companies, or deals from Attio, including names, emails, domains, job titles, social links, deal stages, and any custom attributes you've set up in your workspace.
Salesforce: Import leads and contacts directly from Salesforce, including name, email, company, phone, title, lead status, and all standard and custom fields.
Instantly: Search and look up leads across your Instantly campaigns. Pull contact details (name, email, company, domain, phone), campaign assignment, interest status, email open/reply/click counts, and any custom variables you've attached to leads.
HeyReach: Import leads from your HeyReach LinkedIn outreach campaigns, including name, LinkedIn URL, company, and campaign membership — useful for syncing your LinkedIn pipeline with the rest of your data.
Salesforge: Import contacts from Salesforge, including name, email, company, and sequence data — so you can enrich, analyze, or cross-reference your outreach contacts in Databar.
Folk: Import people and companies from your Folk CRM, including names, emails, phone numbers, company associations, job titles, and any custom fields you've built in Folk.
Fireflies AI: Import your meeting recordings and transcripts from Fireflies, including meeting title, date, participants, and summary data — great for building a searchable log of all your calls.
tl;dv: Import meetings from tl;dv, including meeting metadata, participants, and key moments - so your recorded calls are part of your broader data workflow.
Export Auto-Mapping (New)
Exporters now automatically attempt to map your table columns to the exporter's fields — the same way enrichments already do. Less manual field-matching, fewer setup errors.
Value: saves time when setting up exports, especially for tables with many columns.
Export JSON Dict as Column (New)
When working with JSON columns, you can now extract a full nested JSON value into a separate column (not just text fields). Previously, the only option shown was "Write to another table."
Row Insertion Speed Improvements
Adding large numbers of rows (e.g. 1,000+) is now significantly faster.
Value: bulk imports and automations that write many rows complete much quicker.
UI & Quality of Life Improvements
Several quality-of-life updates shipped this week:
Exporter panel: added local search so you can quickly find and fill in parameters without scrolling — search stays active after losing focus so you can keep mapping fields.
Row detail view: the detail panel now updates as you move between rows with keyboard arrows.
Add row button: simplified to a single "Add row" button (adds 1 row to the bottom) with a small chevron menu for choosing quantity and position (top/bottom). Less cluttered, more intuitive.
Dialog & workspace UI polish: updated workspace settings and column settings dialogs with cleaner designs. The workspace switcher now has a more visible click target.
Import data modal: removed category groupings from the integration picker — cleaner and faster to browse.
Toolbar: buttons no longer get squished on narrower windows — labels collapse to icons gracefully when space is tight.
Search fields: clicking search now auto-focuses so you can start typing immediately (applies to table search, templates, and the data source picker).
Sign in / Register: buttons now show a loading spinner so it's clear your click registered.
Bug Fixes
Fixed broken REST API causing requests to fail on certain table configurations.
Fixed 502 errors that were hitting all requests (urgent incident, resolved).
Fixed Excel formula bugs causing incorrect formula behavior.
Fixed
[object Object]displaying when copying or expanding a cell after changing its type from JSON to text.
Missed our previous updates? Check out our site at databar.ai for the latest news.
About Databar
Databar is a spreadsheet-style platform for working with APIs and go-to-market data. Connect 100+ data sources, enrich leads and companies in real time, transform messy outputs (including JSON), and automate workflows - all in one place. Build repeatable pipelines for prospecting, CRM enrichment, research, and reporting without juggling multiple tools or subscriptions.
February 20th, 2026
Merge Columns (New Transformation)
You can now merge multiple columns into one, using a simple “try this first, then fallback to…” order.
Perfect for messy data where the same field might exist in different columns (e.g. company name from multiple providers).
Value: cleaner tables, fewer manual fixes, and consistent output with smart fallbacks.
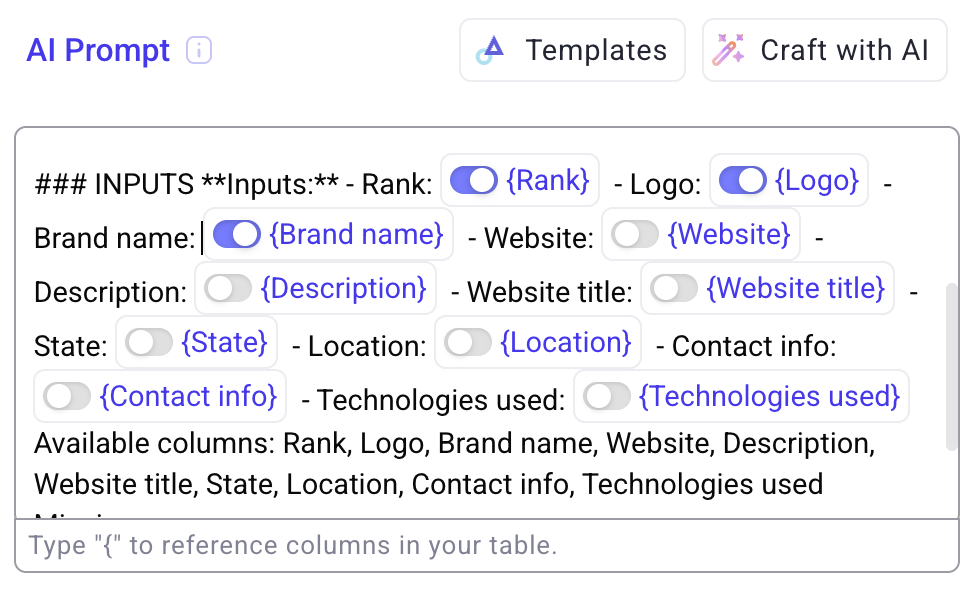
AI Prompt Templates (Workspace-wide)
You can now save AI prompt templates and reuse them across your workspace anytime.
Value: faster workflows, consistent outputs, and no more rewriting prompts you use every day.
JSON Expander: Now in the Sidebar
We moved the JSON Expander into the right-side panel so it no longer overlays your table.
Value: you can keep your table visible while browsing JSON, and add fields more easily without losing context.
JQ Formula (New Transformation for JSON)
We added a new JQ Formula transformation that lets you parse, filter, and manipulate JSON fields per row, then write the result into a new column (stored as JSON).
This is great for turning “giant JSON blobs” (events, activity logs, nested objects, etc.) into usable fields—like counting specific event types, extracting nested values, or building structured outputs.
Value: makes JSON enrichments actually usable inside tables—without exporting to scripts.
JQ is a slightly more advanced language for querying JSON fields. We plan on adding a ‘Generate with AI’ button which will generate the formula for you. However, ChatGPT (and any other LLM) is very good at crafting JQ queries when needed. Here is a guide on JQ: https://jqlang.org/
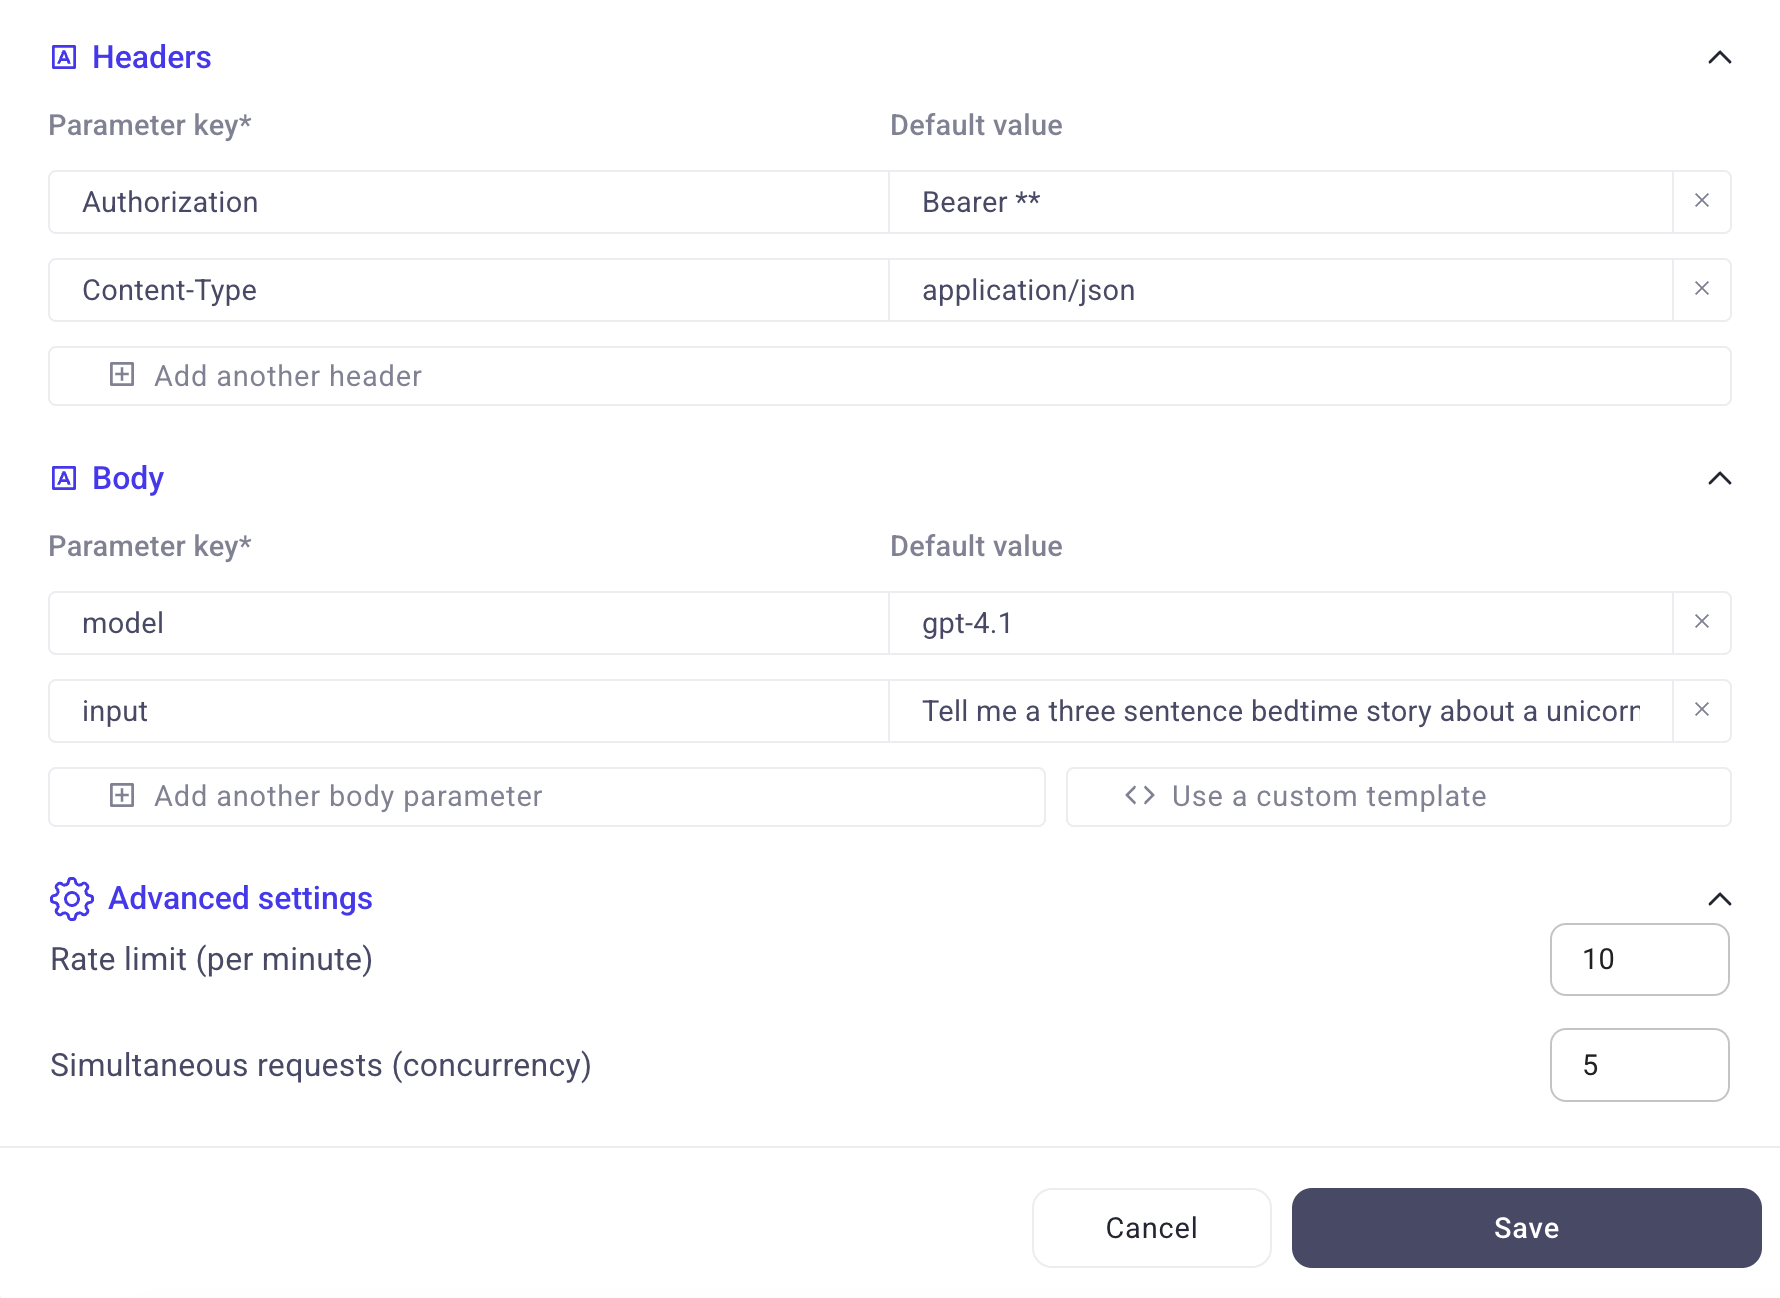
Advanced Custom API Settings: Rate Limit + Concurrency Controls (Scale+)
Scale plan (and above) users can now configure rate limits and concurrency for their custom-added APIs.
This helps power users fine-tune connector performance—speeding up high-volume runs while staying within provider limits and reducing failures/timeouts.
To use this feature simply open any custom API and edit the Rate limit and Simultaneous requests settings at the bottom.
Updated Batch Enrichment Runs (More Stable + Plan-Based Limits)
We’ve improved how batch enrichment runs work to make large runs more stable and reliable. Batch limits are now plan-based, and each plan can increase request rate limits as needed.
Expand: batch runs up to 200k rows
Enterprise and above: batch runs up to 1M rows
Added parameter search for large integrations
To make it easier to find the right parameters and map your table to integrations, we’ve added a search tool on the exporters parameters which lets you quickly search through available values.
Missed our previous updates?
Check out our site at databar.ai for the latest news or the changelog here:
About Databar
Databar is a spreadsheet-style platform for working with APIs and go-to-market data. Connect 100+ data sources, enrich leads and companies in real time, transform messy outputs (including JSON), and automate workflows—all in one place. Build repeatable pipelines for prospecting, CRM enrichment, research, and reporting without juggling multiple tools or subscriptions.
February 19th, 2026
New data providers in waterfall
We’ve added two new data sources to the “Get email by social link” waterfall. That waterfall now includes People Data Labs and FindyMail, increasing coverage and data quality.
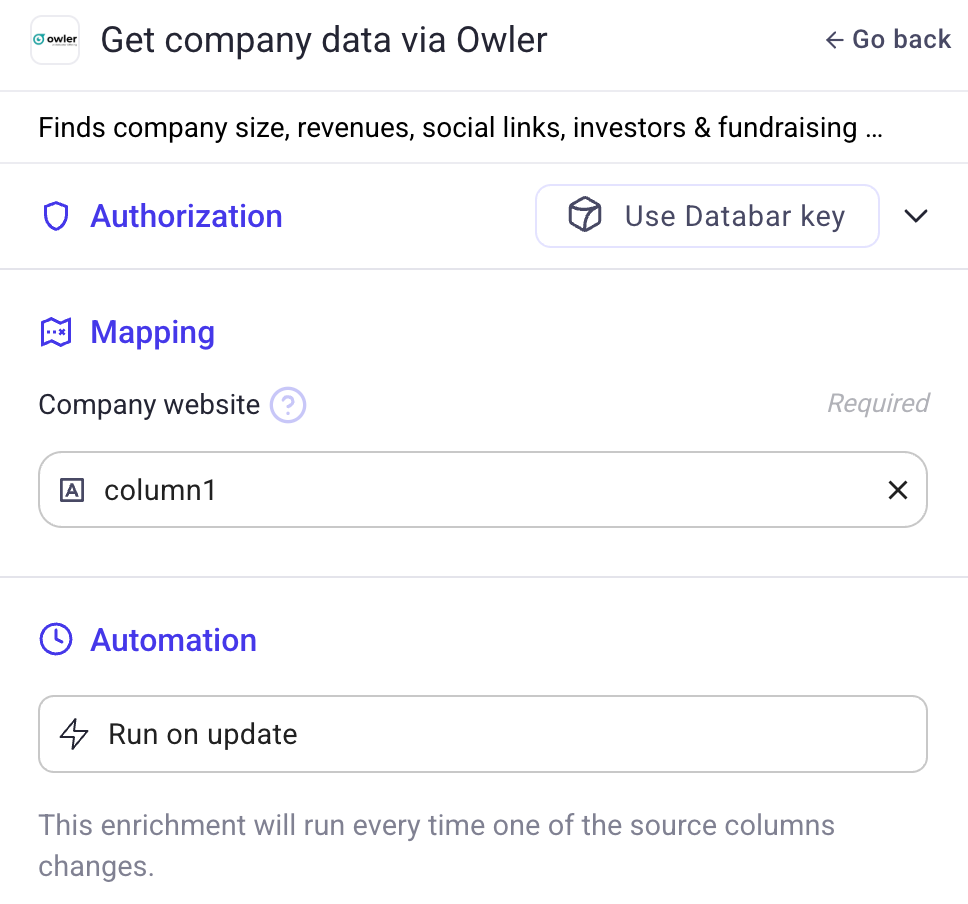
The company data waterfall now includes additional standard fields in the result, including funding rounds, addresses/locations, industries, and estimated revenue.
Pipedrive Integration Re-vamp
Added 6 new inputs & filters to the Pipedrive integration, allowing you to pull Persons and Organizations with more precision. We’ve also added 3 new export to Pipedrive functions:
Create Organization
Update Organization
Update Person
Other updates & bug fixes
🚤 Additional speed & performance updates
When launching an enrichment with 1000+ rows, the initial load will now come on faster & the enrichment will launch right away
Adding rows to bottom/top of table now happens instantly
📖 Re-named and fixed naming for over 800 inputs, making them clearer and more informative
👀 UI Update - no more column lag. Previously, when changing the widths and re-ordering columns quickly (or while an enrichment is running), columns would jump back to their previous position. This issue has been fixed
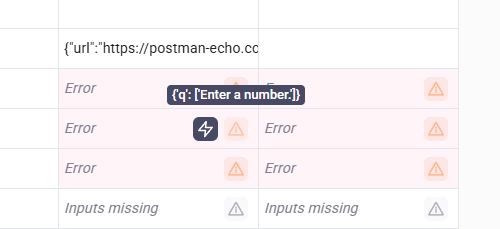
⚠️ Error cells will now display the issue when you hover over the triangle icon so you can quickly debug your automations
🐞 Bug fixes
Several bug fixes to Excel formulas enrichments
Bug fixes to rate limits
Previously, rate limits were not strictly followed and had a 10% overage rate. This issue has been fixed and rate limits will now be strictly followed on all enrichments
Bug fixes for editing AI enrichments (required/optional conditions on column references not saving correctly)
Fixed bug: If you changed the width of columns previously, you may have noticed them jump back to their original width. This issue has been fixed and table edits should be smoother.
February 19th, 2026
Google Sheets Import
We’ve added a new "Import from Google Sheets" feature. When browsing a Google Sheets page, the extension automatically switches to a dedicated import view. You can now copy a range of cells (with headers) and import them directly into Databar via the clipboard.
The normal scraper UI (fields, toggles, view results) is hidden on Google Sheets pages since the scraper doesn't apply there.
Results Page Improvements
The "Preview results" button now closes the side panel automatically when opening the results page, reducing confusion.
CSV downloads are now named after the table/page title (e.g. "Y Combinator companies - Feb 9, 2026.csv").
Fixed CSV files opening incorrectly in Excel -- added UTF-8 BOM so Excel recognizes the format natively without the Text Import Wizard.
Data Parsing Fixes
Duplicate column headers (e.g. two columns named "Name") are now handled gracefully -- the second becomes "Name (2)" instead of silently overwriting data.
Link extraction fixes
Our ‘extract link’ functionality was broken on our latest update - this has now been fixed and link extraction should work normally now.
February 3rd, 2026

We're thrilled to announce v3, a complete redesign of the Databar Chrome Extension! This release introduces a brand new sidebar-based interface, powerful new extraction features, and a streamlined experience for collecting data.
Complete Redesign: New Sidebar Interface
We've rebuilt the extension from the ground up with a new sidebar panel that stays open alongside your browsing. Having a side-bar allows you to see and read through the content of the page you’re on more easily and extract a larger number of fields more easily.
Key benefits:
Persistent workspace that doesn't disappear when interacting with the page
More screen real estate for viewing your fields and data
Seamless element selection without UI interruptions
Additional settings and configuration settings which are now easily available in the sidebar
New Features & Functionality
🔌 Sub-Element Extraction
Select a container element (like a product card or listing), click the Layers button, and instantly see all extractable sub-elements. Pick the specific data points you want (for example, “title”, “price”, “rating”) and they're added as child fields, visually grouped with their parent.
🔑 Easier authentication
You now no longer need to add your Databar API key to send data to Databar. The Chrome extension will now check for any active Databar sessions automatically and add data to that workspace. You can still use API key authentication as an alternative to automatic connections. Configure it once in the sidebar settings and access a specific workspace from anywhere.
👀 Watch mode
If you ever need to collect elements from multiple pages or after a scroll - simply turn on watch mode and the extension will automatically capture any new elements that appear in your tab and add them to the right field!
🧠 Smart CSV Downloads
Exported files now use descriptive filenames: {Page Title} | {Site Name} | {Date}.csv — no more generic "databar extension data" files cluttering your downloads.
🆕 CSS Selector Preview and Reset button
When selecting elements, the preview box now displays the CSS selector being used, giving you better insight into what's being captured.
Quality of life improvements
Custom Tooltips
All buttons now feature helpful tooltips that explain their function. Toggle buttons (Auto-scroll, Watch Mode, etc.) also display their current state.
Additional UI improvements
Cancel Button: Exit selection mode easily with a Cancel button — no need to remember the Escape key
Streamlined Selection Flow: Cleaner "Click an element" messaging consolidated into a single, focused display
Reorganized Results Page: Download CSV and Databar buttons moved to the header for quicker access
Updated Branding: Fresh branding, UI, and easier table controls throughout the extension
Performance improvement and ~40% smaller bundle size — removed code, making the sidebar more responsive and easier to work with
Getting Started with the new extension
Click the Databar icon in your browser toolbar to open the sidebar
Navigate to any webpage with data you want to collect
Click "Add Field" and select elements on the page
Use the Layers button to extract specific sub-elements from containers
Export to CSV or send directly to your Databar workspace
Questions or feedback? We'd love to hear from you!
Install the extension here: Link →
Link to page in the Chrome sotre: Link →
January 23rd, 2026
Although we fell behind on changelog updates after August, we never stopped shipping. Over the past few months we rolled out a large number of improvements across automation, AI, APIs, and the core table experience.
Here are the most important updates you may have missed from August through December.
🔁 Send data between tables
You can now send data from one table to another.
This makes it easy to:
Build multi-step workflows across tables
Append results from automations into separate datasets
Keep source and output data cleanly separated
Currently supported for single-row sends, with more coming.
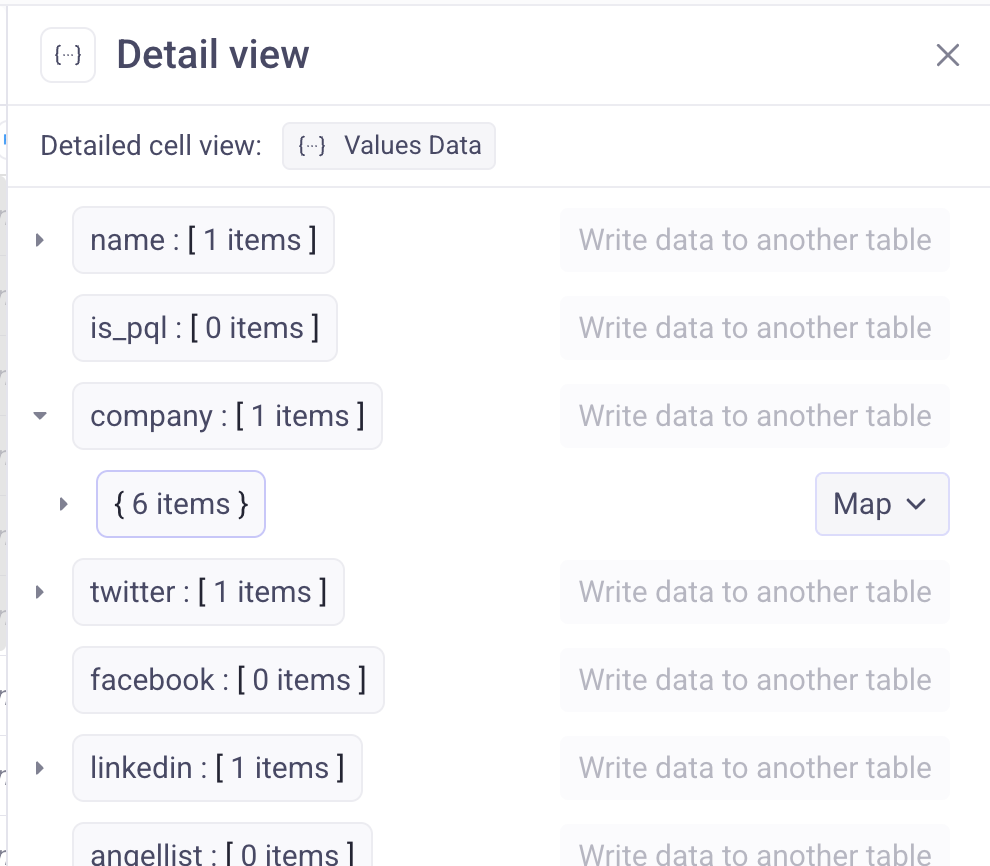
🔍 Detail view for full rows
You can now view a full row in a dedicated sidebar by clicking “View row” in the bottom right when a cell is selected.
This makes it much easier to:
Inspect large rows with many columns
Debug automations
Review AI outputs without horizontal scrolling
The experience is similar to tools like Asana or Linear.
✅ Major update: Cell-level enrichment statuses
Previously, enrichment statuses were stored only at the row level. This made it hard to understand what happened inside complex automations or why something failed.
Databar now stores and displays enrichment statuses at the cell-level.
This unlocks several important improvements:
You can see exactly what happened at each step of an automation
Failures are visible at the cell level, not hidden at the row level
Most importantly, multiple enrichments can now run in parallel, significantly speeding up execution on large tables
This change removes a major bottleneck for advanced workflows.

➕ Add many rows at once
Previously, you could only add up to 10 rows at a time.
You can now add as many rows as you want to the top or bottom of a table using a dedicated input. This makes bulk data entry much faster.

🤖 AI prompt generator
You can now generate optimized AI prompts directly inside Databar.
This works for:
AI Researcher agents
Custom AI prompt enrichments
Simply describe what you want, and Databar will generate a well-structured prompt for you.
🧠 New AI models
We updated our AI model lineup to reflect the latest developments in the AI ecosystem, improving output quality and reliability across AI features.
🔌 Custom API connectors improvements
When adding your own API connectors, Databar now supports:
PATCH requests
PUT requests
In addition to GET and POST. This allows for more complete and flexible API integrations.
🔗 Required column references for AI and text enrichments
You can now mark column references as required in AI and free-text enrichments.
If a required column is empty, the enrichment will not run. This prevents unnecessary executions and avoids invalid AI inputs.
To mark an input as required simply click the toggle in the reference. If the toggle is not selected, the field is marked as optional.
🧬 Map columns directly to nested JSON values
You no longer need to expand JSON into separate columns first.
Columns can now be mapped directly to nested JSON values, simplifying schemas and reducing extra steps in workflows.
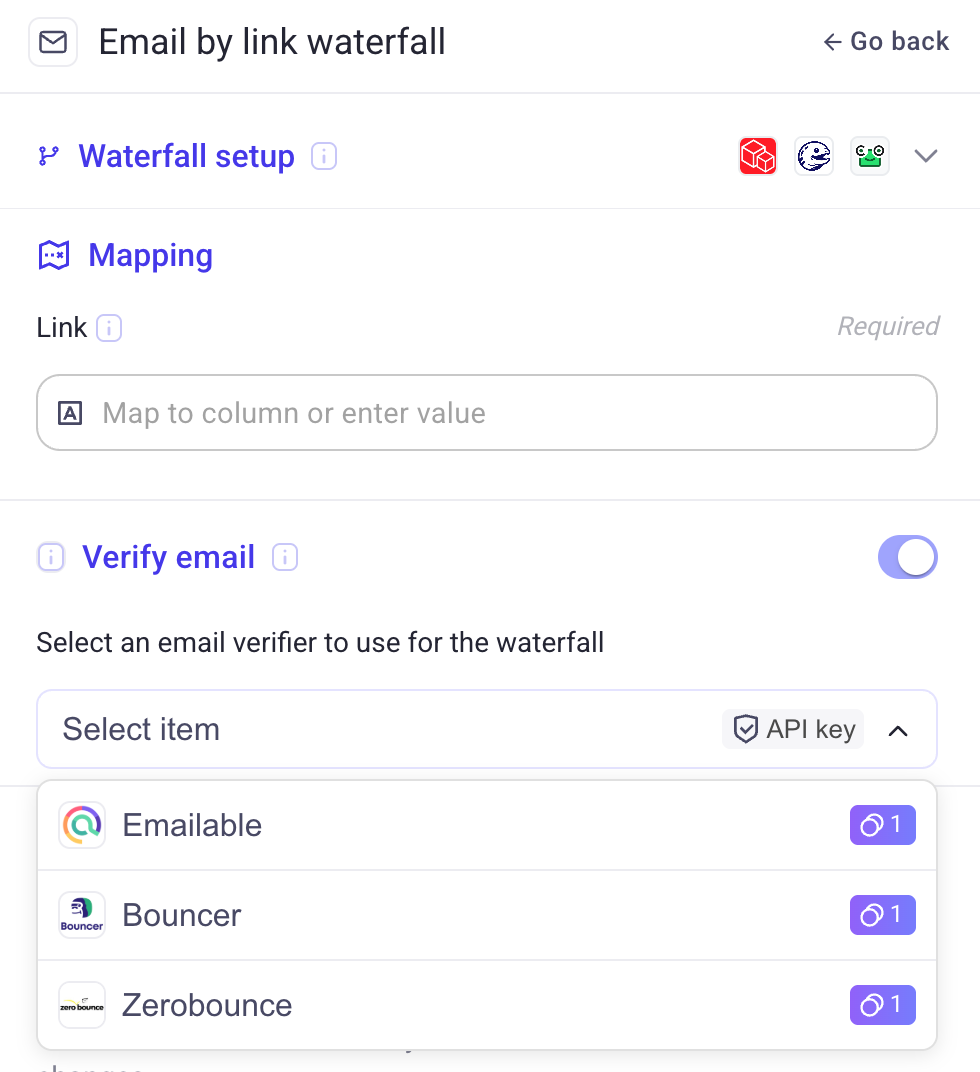
📧 Email waterfall verifiers
We added three email verifiers to email finder waterfalls.
Each verifier checks whether an email is valid, and if not, the workflow automatically falls back to the next provider. This improves deliverability and data quality.
▶️ Run conditions now apply everywhere
Run conditions now trigger correctly whether you:
Run all rows
Run a single row
Previously, conditions only applied when running all rows. This is now consistent across execution modes.
💸 Removed action charges for formulas and JSON tools
We no longer charge actions for:
JSON Expander
Formulas
Similar transformation-only operations
Only enrichments that call external services consume actions.
⚙️ Full-screen settings
Personal account settings and workspace settings have been consolidated into a single, full-screen settings page for easier navigation and management.
🧹 Customizable AI outputs
You can now remove the “result” and “reasoning” fields from:
AI Researcher outputs
AI prompt enrichments
These fields were previously hard-coded and are now fully optional.
🎨 General UI and usability improvements
We shipped a number of UI updates focused on clarity and usability:
Updated icons and visuals
Cleaner layouts
Improved interaction consistency across the app
January 23rd, 2026

Major speed and infrastructure updates
Our last changelog was back in August 2025, when we shipped updates to the REST API, Excel formulas, de-duplication, enrichment groups, text splitting, parameter grouping, filters, and more.
Since then, Databar usage has grown significantly. With that growth came real infrastructure challenges. Enrichment queues started taking longer than they should, and larger tables with 1,000+ rows began to feel sluggish.
So we hit pause on shipping new features and spent the last two months focused entirely on stability, performance, and tech debt.
The result is a noticeably faster and more reliable Databar.
🚤 Infrastructure and speed improvements
We’ve reworked large parts of our infrastructure to make Databar feel smooth and responsive, even at scale.
What’s changed:
Enrichment queues are now scaled and fail-proofed to run faster and more reliably, even under heavy load
Tables use significantly less memory and no longer lag as they grow
Overall interaction now feels closer to Google Sheets: smooth scrolling, fast updates, and no freezing
If you work with large datasets, you should feel the difference immediately.
📜 Infinite scroll for large tables
Previously, tables loaded 600 rows at a time. Scrolling through large datasets meant waiting for each batch to load.
Databar now supports infinite scroll.
You can jump to the middle or the very end of a table instantly, no matter how large it is. This makes working with big datasets dramatically easier and faster.
⚡ Faster JSON Expander
We’ve also significantly optimized the JSON Expander.
If you export multiple values from a JSON cell into new columns, those exports now run up to 6x faster. JSON values are processed in parallel and appear at the same time, which removes UI lag and reduces pressure on enrichment queues.
Faster initial load
We’ve optimized large chunks of our code making load times & overall performance significantly better.
This update was about making Databar solid at scale. Faster tables, faster enrichments, and infrastructure that can keep up as usage grows.
As always, if you notice anything off or have feedback, let us know!
August 7th, 2025
Improved
We’re excited to share a major upgrade to the Databar REST API: you can now apply filters directly to your GET requests!
Until now, the API returned the full table, with no way to narrow down results. Many of you asked for the ability to fetch only the rows you need — and we listened.
With this latest update, you can filter rows using EQUALS and CONTAINS operators, allowing you to query for rows where specific columns match or include a given string. This makes the API significantly more powerful for integrations and custom workflows.
📌 Example use cases:
Retrieve all rows where the description column contains the word "enrichment"
Get entries where the company_name column equals "Databar"
🔒 Note: This feature is currently available on Scale and Expand plans.
If you’re on a different plan and would like access, reach out to us — we’re happy to help!
August 3rd, 2025
New
Improved
Fixed
This month’s updates are all about giving you cleaner data, more control, and less manual work inside Databar.
We’ve created a short video covering the main updates. Check it out here:
🧮 Excel Formula Support - your spreadsheet superpowers, inside Databar
You can now use familiar Excel formulas directly in your Databar tables. No more exporting to Excel or Google Sheets just to run simple logic or math.
Examples:
=IF(A2>100, “High”, “Low”) → flag companies above a certain size.
=CONCATENATE(A2, “ “, B2) → merge first name + last name into a single field.
=OR(A2=“USA”, B2>500) → apply flexible filters for better targeting.
=SUM(A:A), =AVERAGE(B:B), =ROUND(C2, 2) → do quick calculations without leaving Databar.
👉 If you know Excel, you already know how to make your Databar tables smarter.
🧹 Single‑Column Deduplication - fast one‑off cleanup
Sometimes you don’t need to overhaul your entire table, just tidy up one column. With single‑column deduplication, you can now remove duplicates based on a specific column.
Example:
You have a list of leads with duplicate email addresses. Instead of deleting entire rows or checking manually, one click keeps only unique emails and clears the clutter.
De-duplication is an irreversible action! Please make sure you are certain about the column you want to de-duplicate, as it will permanently delete duplicate rows in your table.
👉 Perfect for quick cleanup when importing CSVs, running exports, or preparing outreach lists.
♻️ Automatic Deduplication — keep your tables clean, forever
For ongoing data flows, manual cleanup isn’t enough. That’s where automatic deduplication comes in.
You can now set rules that enforce uniqueness automatically.
Example:
You’re importing new contacts every day from LinkedIn, a CRM, or another table. With automatic deduplication enabled on specific columns, Databar will prevent duplicates the moment they land.
Your contact lists stay clean, your outreach campaigns avoid double‑sending, and your CRM never fills up with messy records.
👉 Think of it as auto‑pilot for data hygiene.
📂 Group Enrichment Columns
Working with wide tables can get messy fast. With the new Group Columns feature, you can now collapse multiple columns from an enrichment into a single grouped view. Enrichments can still be run in collapsed view and you can ungroup columns any time by clicking the double-arrow button in the top left of the group.
👉 Perfect for cleaning up busy tables and focusing only on the data that matters.
📊 Split Text to Columns
Have combined values like "John Doe, CEO" in a single cell? Now you can split them into separate Name and Title columns instantly. You can also select what value you want to split values by (can be a space (“ “), dash (-), comma (,) or any other character.
👉 A small tool that saves big.
🎛️ Cleaner Parameter Inputs
We’ve reorganized filters so the most critical ones are grouped together. Searching for companies and people is now faster and less overwhelming. You’ll notice that Employee count or Revenue estimate ranges in the filters will now be grouped into an “Employee count” parameter, instead of being two separate “Employees Max” and “Employees Min” inputs.
💰 Smarter Pricing Previews
Some enrichments are priced by the number of rows you request (via Limit or # Results).
Previously, we only showed the price for 1 result by default.
Now, the expected total price is displayed right in the enrichment sidebar before you run it — so you always know the exact cost upfront.
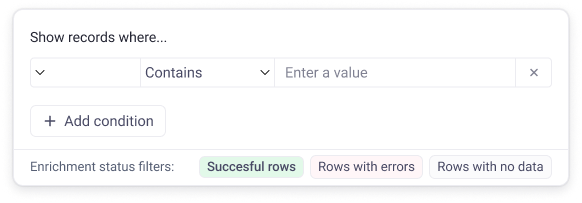
🔍 Views → Filters
The old “Views” (Success, No Data, Errors) are now integrated into the Filters panel. Cleaner layout, easier navigation.
⚡ Faster Enrichment Search
We’ve fine‑tuned our search algorithm to bring back better results, faster.
🔐 Streamlined Authorization
The Authorization menu has been tucked into a dropdown — still there when you need it, invisible when you don’t.
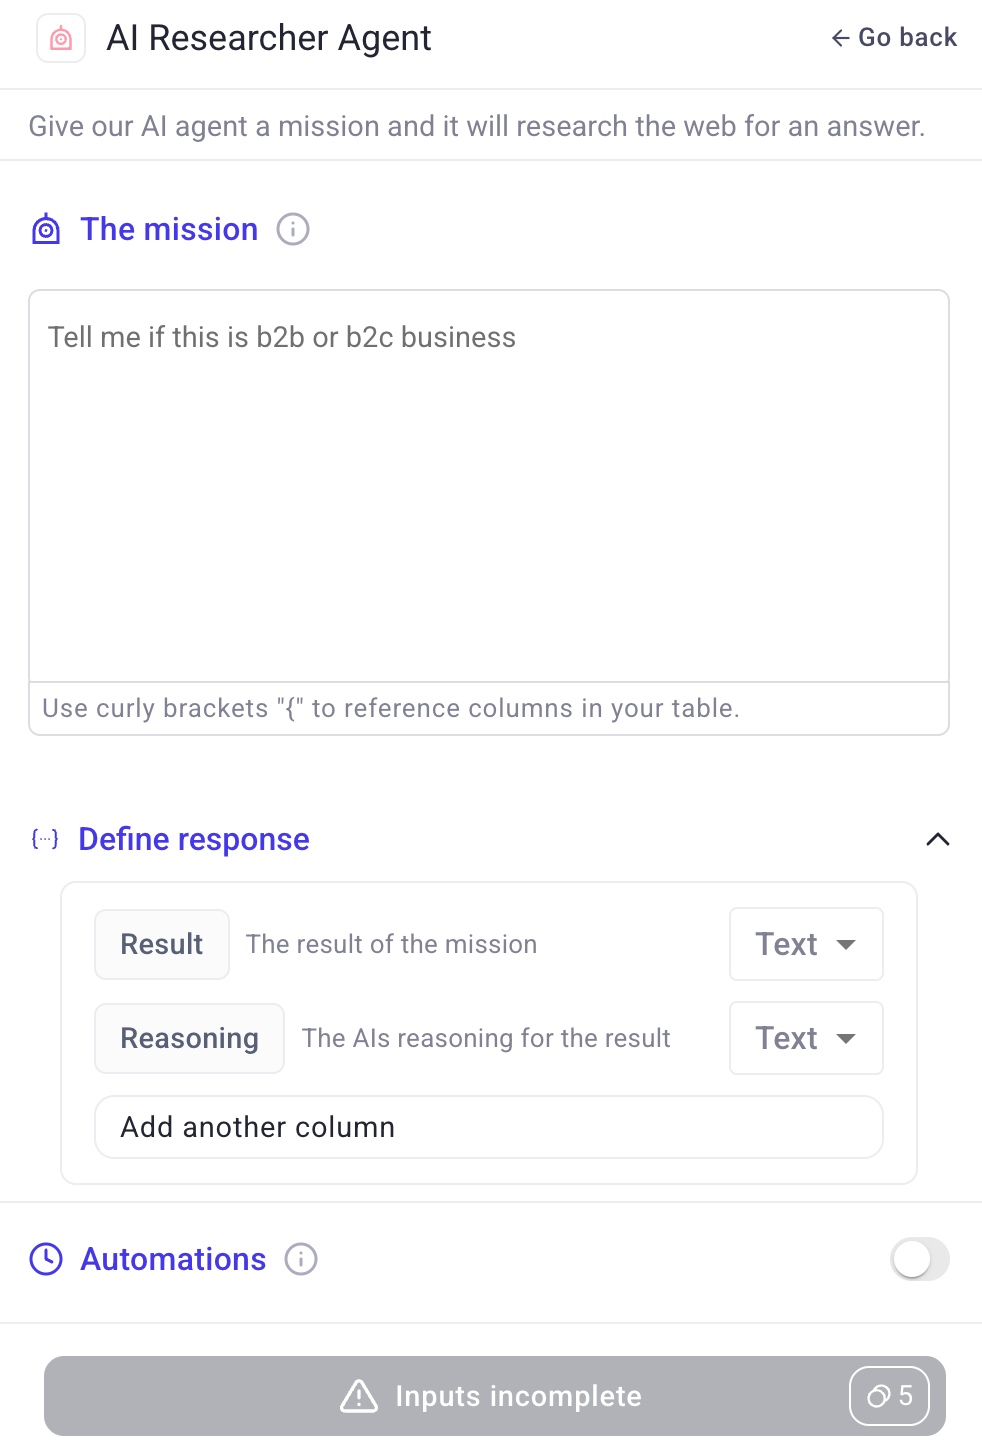
🤖 New AI Researcher Agent
Enrich your data with AI‑powered research across the web. Instead of looking at a single page, you can now feed the agent a prompt + list of links, and it will automatically:
Visit each website
Extract the information you asked for
Return it in a clean, structured format
Examples of how you can use it:
Give the agent a list of company websites → “Get their pricing model” → returns clear pricing tiers for each site.
Upload a list of LinkedIn company pages → “Find the CEO” → returns CEO names and roles.
Provide startup websites → “Check if they recently raised funding” → returns yes/no with details.
👉 Just tell the agent what you need, and it will enrich your tables for you.
Other bug fixes and improvements
The enrichment side-bar will now close after you add an enrichment and your screen will automatically scroll to the columns that were added
We’ve fixed many bugs & errors coming from data sources & APIs which have recently changed
Scaled our infrastructure - we can now process larger batches of enrichments faster
A brand new credit & billing system - check out that change log here.